
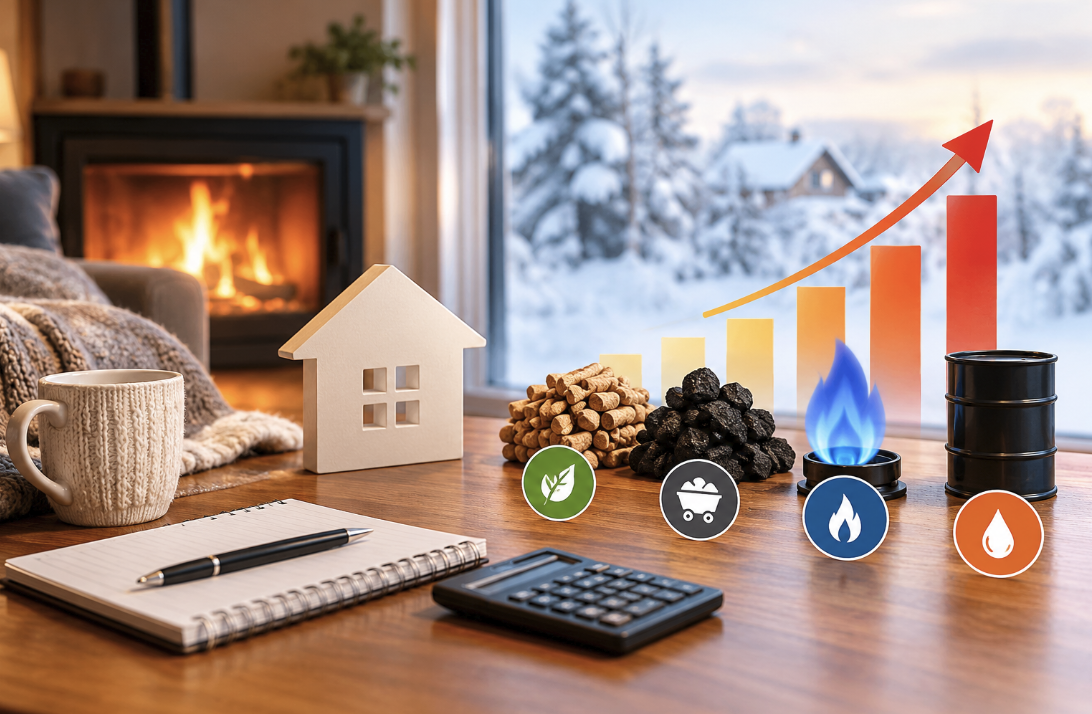
Few household bills swing as hard as heating, because they follow both the energy market and the thermometer. A federal forecast released in early October suggests this winter will be uneven: cheaper for many natural gas homes, a bit costlier for electric homes, and sharply higher for anyone filling a heating oil tank.
In this article we will explore the Energy Information Administration’s expected spending by fuel and region, the weather assumptions behind it, the limits of using it to pick a fuel, and a practical order of steps.
The Outlook in Brief
On October 6, 2026, the US Energy Information Administration published its winter fuels perspective, drawn from the October edition of its Short-Term Energy Outlook. It estimates what the average household will spend from November through March, grouped by the fuel that household uses as its primary source of heat. The numbers are nominal, meaning they are not adjusted for inflation, so they reflect the dollars you will hand over rather than a purchasing-power comparison with past years.
The headline is a split. Natural gas households are expected to spend less than last winter, propane households slightly less, electric households a little more, and heating oil households a great deal more. That is a notable reversal for oil customers, who often face the largest bills to begin with. Trade outlets including AJOT, Energy News Beat and the BOE Report carried the forecast, which tells you how closely energy markets watch it.
Before diving into the figures, it helps to remember what this kind of outlook is. It is an average across a very large number of homes, built from assumptions about prices, weather and how much fuel a typical household burns. Your house is not the average house. A drafty century-old farmhouse and a tight new townhouse can sit on the same street and use wildly different amounts of fuel, so treat every number below as a reference point rather than a prediction of your own invoice.
A useful habit is to write down your own figure for last winter next to the agency’s average for your fuel, then watch the percentage change rather than the absolute dollars. The direction of the change travels better from the average household to yours than the dollar amount does.
The agency also makes a point of saying its figures are a broad guide for comparing one winter with another. They are not meant to tell a homeowner how much money a fuel switch would save. We will come back to that caution in its own section, because it matters more than any single figure in the report.
Fuel by Fuel Spending Compared
The simplest way to read the outlook is to look at three things for each fuel: the price, the amount used, and the resulting five-month total. A bill is just price multiplied by quantity, so a change in the total always comes from one of those two levers, or both. The table below lays out the national averages for the coming winter, with the change from last winter in parentheses.
| Primary fuel | Expected spending, November to March | Unit price | Expected use |
| Natural gas | $640 (down 9%) | $13.44 per thousand cubic feet (down 9%) | 48 thousand cubic feet (flat) |
| Electricity | $1,196 (up 4%) | 18.23 cents per kWh (up 3%) | 6,562 kWh (up 1%) |
| Propane | $1,246 (down 3%) | $2.52 per gallon (down 2%) | 494 gallons (down 1%) |
| Heating oil | $2,115 (up 21%) | $5.26 per gallon (up 34%) | 402 gallons (down 9%) |
Reading across a row shows how each total is assembled, and reading down a column shows how differently the fuels are priced. Gas is priced per thousand cubic feet, electricity per kilowatt-hour, propane and oil per gallon, so the unit prices cannot be compared directly with each other; only the final spending column puts everything on one footing, and even that column rests on the average home’s equipment. Two things jump out. First, the totals are far apart. A natural gas household is expected to spend less than a third of what a heating oil household does. Second, the direction of travel differs by fuel, and in the case of natural gas the entire decline comes from price, since the amount burned is flat.
Natural gas
Natural gas is the cheapest option on the table and also the one with the best news. The expected $640 is down 9% from last winter, driven by a unit price of $13.44 per thousand cubic feet that is also down 9%. Use is flat at 48 thousand cubic feet, which is what you would expect when the national weather assumption is unchanged.
Gas is the fuel behind a large share of American home heating, so a price decline here is the biggest single piece of good news in the outlook for ordinary households. If you heat with a gas furnace or boiler, and if you are not in the colder West, your bill is likely to look better than last year unless your local weather or your local utility’s rates break from the national pattern.
Electricity
Electric heating households face a modest increase. Expected spending is $1,196, up 4%, which comes from a price of 18.23 cents per kilowatt-hour that is up 3% and use of 6,562 kilowatt-hours that is up 1%. Notice that electricity here is the total for a home whose main heat source is electric, so it includes the lights, the refrigerator and the water heater alongside the heating equipment.
Electricity prices tend to move slowly and in one direction, partly because rates are set through regulated processes rather than a daily market. In the Northeast the electricity figure is down 3% while the Midwest, South and West are each up, which is a good example of why a national average of 4% hides real variety. That makes the national number more predictable than oil, but it also means there is less chance of relief if the winter turns out mild.
Propane
Propane lands in between. The expected $1,246 is down 3%, built on a price of $2.52 per gallon, down 2%, and use of 494 gallons, down 1%. Each piece moved only slightly, which gives propane customers a winter that looks a lot like the last one.
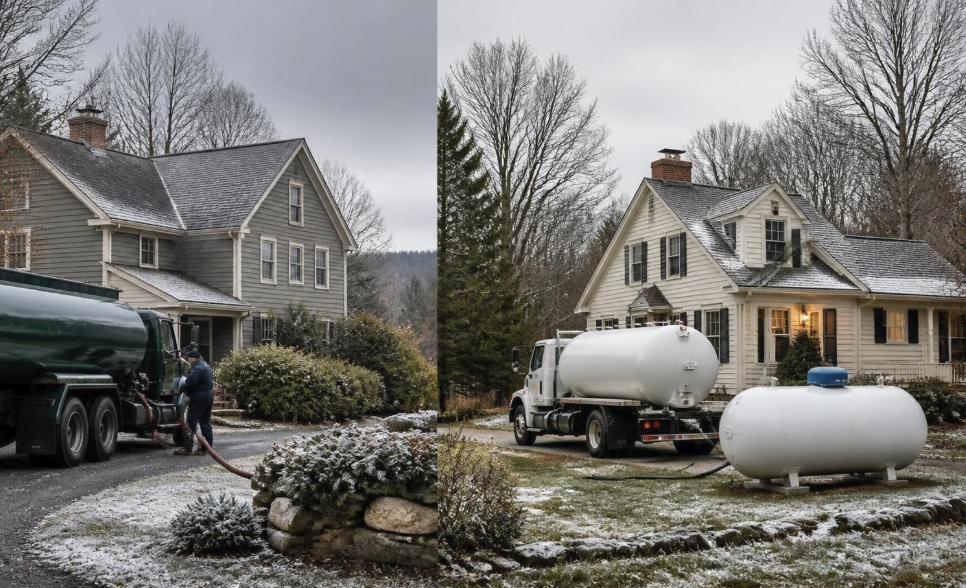
Propane’s modest movement is worth a short note for rural households, many of which have no gas main and a choice mostly between propane, oil and electricity. For them the outlook says propane is close to flat, electricity is up a little, and oil is the expensive outlier, so the relative ranking among delivered fuels shifts toward propane compared with last winter. Propane is usually delivered by truck and stored in a tank on the property, so customers who have a contract or a prepay option sometimes have more control over their price than they realize. If your supplier offers a fixed-price or capped-price plan, the time to read the terms is before the cold arrives, not in the first week of January.
Heating Oil Stands Out
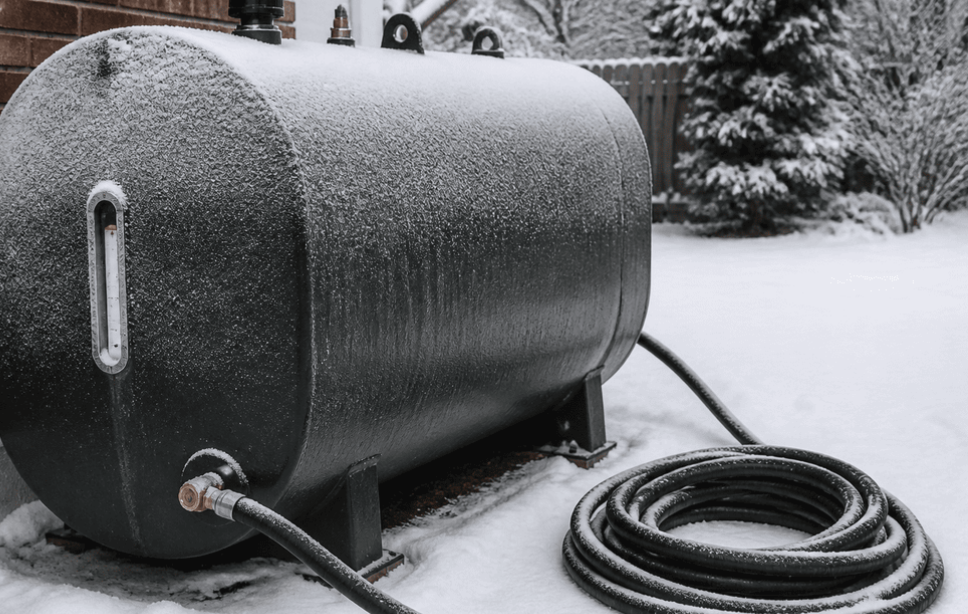
Heating oil is the story of this outlook. The expected household spending of $2,115 is up 21%, and the reason is plain in the price column: $5.26 per gallon, up 34% from last winter. Households are expected to burn less, about 402 gallons, down 9%, but the cut in volume is nowhere near large enough to offset the price jump. Multiply the two and you arrive at the bill, which is roughly what the table shows.
The size of the gap with other fuels is worth sitting with. On the agency’s averages, an oil-heated home is looking at a bill more than three times that of a gas-heated home and well above even propane or electricity. The comparison is imperfect, since oil is concentrated in certain kinds of housing and certain regions rather than spread evenly, but it explains why heating oil customers are the group most likely to feel the winter in their budgets.
Why the Volume Falls But the Bill Rises
When prices rise sharply, households tend to economize at the margin. They turn the thermostat down a degree or two, close off rooms, or let the schedule run cooler overnight. The outlook’s 9% drop in oil use is consistent with that kind of behavior, though the summary we are drawing on does not separate the cause, and weather and efficiency changes could also play a role. The important point is that conservation softens the blow but does not cancel it.
What Oil Customers Can Do
If you heat with oil, there are a few levers worth pulling before the heaviest months arrive. Ask your dealer whether a price-protection or fixed-price program is offered, and read how it handles a price drop, because some plans lock you in at the high number. Consider whether a scheduled automatic delivery or a will-call arrangement suits you better, and compare at least two or three local dealers, since prices can differ from one supplier to the next.
Weatherization is the other lever. Air sealing around doors, windows and the attic hatch, plus insulation where it is thin, reduces the number of gallons you need regardless of what the price does. A service visit to clean and tune the burner can also keep the equipment running efficiently. Some states and utilities run assistance or weatherization programs, and rules and availability vary, so check with your state energy office or the federal low-income home energy assistance program if your budget is stretched.
Regional Differences Across the Country
National averages hide a lot. The agency also breaks out expected spending by region for the two fuels that dominate American homes, natural gas and electricity, and the picture changes depending on where you live. Differences in climate, housing and local prices all feed into these numbers.
One caution before the region-by-region tour: a region is a very large place. The Northeast includes Maine and Maryland, the South includes Florida and West Virginia, and the climate and fuel mix inside each region vary a great deal. Use the regional numbers to see which way the wind is blowing, and lean on your own utility bills for the details.
Northeast
For natural gas, the Northeast is expected to spend $879, down 14%. For electricity the expected figure is $1,637, down 3%. These are the highest numbers in both tables, which fits a region with long, cold winters and older housing, and the declines are welcome news in a place where bills run high. The weather assumption helps explain it: heating degree days in the Northeast are projected at 4,331, down 12% from last winter.
Midwest
Midwestern gas households are expected to spend $613, down 10%, while electric households are expected to spend $1,380, up 3%. The Midwest has the most heating degree days of any region in the outlook, at 4,802, down 2%, so this is a region that needs a lot of heat but pays relatively little for gas. That combination is a reminder that unit price matters as much as cold.
South
In the South, gas spending is expected to be $511, down 15%, the largest percentage decline among the regions and the lowest dollar amount. Electricity is $1,079, up 3%. The South is the mildest region, with 2,021 heating degree days, up 1%. Heating needs are lower, but many Southern homes rely on electricity, so the rise in the power price lands on a lot of households.
West
The West is the outlier. Natural gas spending is expected to be $590, up 7%, and electricity is $1,151, up 9%, the biggest increase for electricity anywhere. The weather assumption explains part of this: heating degree days in the West are projected at 2,781, which is up 25% from last winter. A colder baseline means more heating, and more heating means a bigger bill. Western households that rely on electricity for warmth should read the 9% rise as a prompt to check their thermostat schedules and any time-of use rate options their utility offers, since shifting some use away from expensive hours can trim a bill without changing comfort much. Still, spending rose by less than the weather did for gas, which shows that price and use do not move in lockstep.
Weather Assumptions Behind the Numbers
Every winter forecast is really two forecasts glued together: one about prices and one about weather. The agency uses heating degree days, a standard measure of how cold it is. A day with an average temperature below a reference point contributes degree days equal to the shortfall, so a colder winter produces a higher total and a higher fuel demand.
The Base Case
The base case assumes 3,155 heating degree days nationally, flat compared with last winter. By month, the outlook assumes 479 in November, 714 in December, 791 in January, 644 in February and 526 in March. January is the heaviest month, accounting for about a quarter of the winter’s heating demand, and December through February together carry more than two thirds of it.
That seasonal shape has a practical consequence. Your bills will not arrive in five equal installments. If you are on a budget billing plan, you spread the cost across the year, but if you pay as you go, the heaviest payments come in the dead of winter. Planning for the January and February peaks, rather than dividing the seasonal total by five, avoids an unpleasant surprise.
Colder and Warmer Side Cases
The agency also runs two side cases in which every region is 10% colder or 10% warmer than the base case. These are not forecasts, but they show how sensitive the totals are to the weather. The summary we are drawing on does not state the dollar impact of those scenarios, so we will not guess at it. What you can reason out for yourself is that quantity used rises with cold, and so a colder winter would push fuel use and bills up for every fuel, while a warmer one would pull them down.
The sensible reading is to treat the base case as the middle of a range. Households that heat with the more expensive fuels have more to lose in a cold snap, since each extra gallon of oil costs far more than the equivalent extra amount of gas. A cushion in the household budget for a colder-than-assumed winter is cheap insurance. It also helps to remember that cold arrives in spells, not as a smooth average, so a single frigid week can cost more than the outlook’s monthly figure suggests even when the season as a whole ends up close to normal.
Why Regional Weather Matters More Than the National Figure
The national flat assumption conceals sharp regional shifts. The Northeast is expected to be 12% milder in degree-day terms, the Midwest 2% milder, the South 1% colder and the West 25% colder. A household in Boston and a household in Seattle are not living through the same winter, even though the national average says nothing changed. When you read a headline about national heating costs, translate it into your region before deciding whether to worry.
Limits of Comparing Fuels
It is tempting to look at the table and conclude that everyone should switch to natural gas. The agency itself warns against that. Its figures are a broad guide for comparing winters, and not a reliable basis for predicting how much a household would save by changing fuels. Housing characteristics and efficiency differ too much from home to home.
Efficiency is Not the Same Across Equipment
Different heating systems convert energy into warmth at different rates. A modern high-efficiency furnace wastes much less than an old one, and electric heat pumps work differently from electric resistance heaters, moving heat rather than creating it. Because the national averages blend every kind of equipment together, they cannot tell you what a specific newer system would cost to run in your house. Ask an installer for an estimate that uses your own equipment ratings and your own utility rates.
Upfront Costs and Availability
Switching fuels is not a free swap. You may need new equipment, a gas line, a service upgrade to the electrical panel, or ductwork changes, and in many places natural gas simply is not available at your address. Incentives, rebates and tax credits for efficient equipment exist in some places and change from time to time, so check current rules with your utility, your state energy office or the federal government before committing.
Price Volatility Cuts Both Ways
Fuel prices that look attractive this winter can shift by next winter, and a conversion is a decade-long commitment. The better question is not which fuel is cheapest this year but which system is efficient, affordable to install, and resilient in your home over the long run. A fuel-switch decision made on one season’s average is the kind of decision the agency is warning readers away from.
A Sensible Order of Choices
For most households, the best response to an outlook like this is not a dramatic change but a short sequence of moves, in rough order of cost and effort. The first steps cost little and pay off whichever fuel you use. The later steps are bigger and should wait until you have good information.
Start With the Bill you Already Have
Pull up last winter’s bills and look at the heaviest month. That is your own baseline, and it is a far better guide for your household than any national average. Compare it with the agency’s direction of change for your fuel: if you heat with gas, plan for something modestly lower, if you heat with electricity, something slightly higher, and if you heat with oil, something much higher unless you reduce use or lock in a price.
Trim the Demand
Seal obvious air leaks, add weatherstripping, change furnace filters on schedule, and consider a programmable or smart thermostat that lowers the temperature when nobody is home or asleep. These steps reduce consumption for every fuel, and reducing quantity is the one lever fully under your control. Window coverings matter too: closing insulating curtains at night and opening them on sunny days lets the sun do some of the work for free. Even a degree or two of setback can matter over five months, though the exact savings depend on your home and equipment.
Manage the Payment
If your utility or dealer offers budget billing, ask how the plan is trued up at year end. If you are eligible for assistance programs, apply early, since funds can run out. If you heat with delivered fuel, ask about pricing options before the first cold week, not after. Keep the tank from running low, too, because emergency or small-quantity deliveries often cost more per gallon than a regular scheduled fill. For electric and gas customers, a quick call to the utility about payment plans, in case a very cold month produces a bill you cannot cover at once, is far easier before a shutoff notice than after one.
Only Then Consider a Switch
If you are weighing a switch, say from oil to another fuel, gather quotes that use your own house and your own rates, ask about incentives, and compare the full cost over many years. Treat the agency’s table as background, not as a quote. If a salesperson leans on a national average to promise a specific savings figure, ask them to show the math using your own usage history, since that is exactly the leap the agency cautions against. A licensed heating contractor or an energy auditor can advise on your specific situation, and your utility or state energy office can confirm what programs apply where you live.
Frequently Asked Questions
How much will it cost to heat a home this winter?
It depends on the fuel. The agency expects average household spending from November through March of $640 for natural gas, $1,196 for electricity, $1,246 for propane and $2,115 for heating oil. Your own bill will differ with your home, equipment and local weather.
Will heating oil prices go up this winter?
The outlook assumes a price of $5.26 per gallon, up 34% from last winter. Households are expected to use about 9% less, but total spending is still projected to rise 21%. Forecasts can change, so check with local dealers.
Is it cheaper to heat with natural gas or electricity?
On the agency’s national averages, natural gas is expected to cost $640 and electricity $1,196 over the winter. That does not mean a switch would save you money, because efficiency, equipment and upfront costs vary. Get quotes based on your own home.
What if winter is colder than the EIA expects?
The base case assumes weather flat with last winter, and the agency also runs side cases that are 10% colder or 10% warmer in every region. A colder winter would raise fuel use and bills for all fuels. It is wise to keep a little room in the budget.
Why is the West expecting higher heating bills?
The outlook projects heating degree days in the West up 25% from last winter, which means a colder baseline. Western natural gas spending is expected to rise 7% and electricity 9%. Other regions mostly see declines or small increases.
Should I switch fuels based on the EIA outlook?
The agency says its figures are a broad guide for comparing winters, not a reliable basis for predicting savings from switching fuels. Housing and efficiency differences matter too much. Ask a licensed contractor or energy auditor for an estimate specific to your house.